The preview version of Microsoft Dynamics 365 Business Central 2026 Wave 1 (BC28) introduces several powerful enhancements designed to help organizations make smarter decisions using real-time business insights.
One of the most valuable additions in this release is the Item Statistics page, a feature that provides deeper insights into an item’s inventory value, sales performance, and profitability metrics across multiple time periods.
This enhancement enables businesses to quickly evaluate how products are performing and identify opportunities to improve profitability.
What is the Item Statistics Feature?
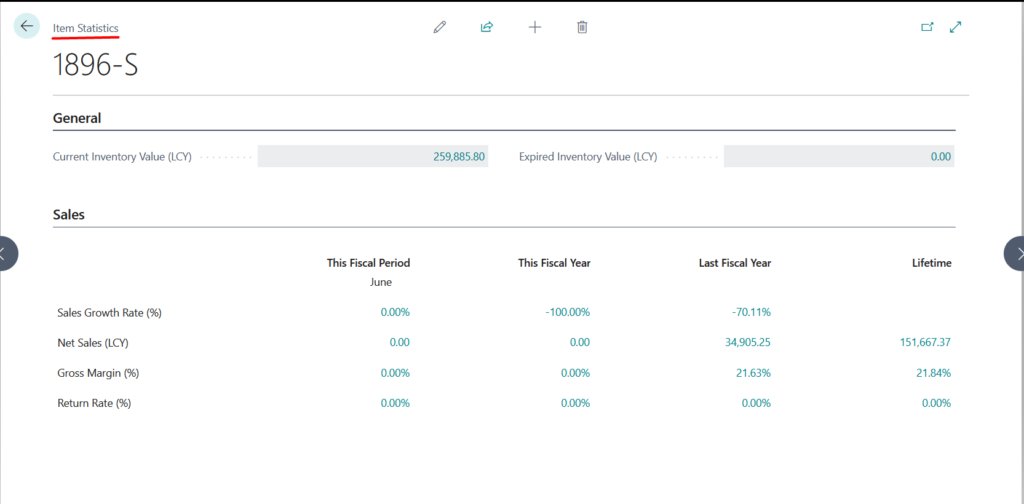
The Item Statistics page provides financial and performance metrics for an item across different time periods, allowing users to evaluate inventory value, sales performance, and return behavior in a single consolidated view.
This helps business users and inventory managers make faster and more informed decisions.
Key Inventory Metrics
Current Inventory Value: This metric shows the current value of inventory in local currency (LCY).
Calculation: Cost Amount (Actual) + Cost Amount (Expected) (from posted Value Entries for the item)
This provides a real-time view of the total value tied up in inventory.
Expired Inventory Value: This metric helps businesses identify obsolete or expired inventory.
It is applicable to items that use item tracking and expiration dates.
Calculation: Cost Amount (Actual) + Cost Amount (Expected) from Value Entries applied to open Item Ledger Entries with an expiration date before the Work Date.
This allows organizations to take timely actions such as:
Discounting products
Removing obsolete stock
Improving warehouse efficiency
Sales Performance Analysis
The Sales section in Item Statistics provides key metrics across four time periods, Time Periods Included
 This Fiscal Period: Current accounting period in the fiscal year.
 This Fiscal Year: Current fiscal year-to-date.
 Last Fiscal Year: Previous fiscal year.
 Lifetime: All transactions since the item was created.
These time comparisons help organizations quickly identify trends and product performance.
Key Sales Metrics
| Metric | Description | Formula | Business Insight |
|---|---|---|---|
| Sales Growth Rate (%) | Helps identify demand trends by comparing sales between two periods. | (Sales in Current Period − Sales in Prior Period) ÷ Sales in Prior Period | Positive value indicates sales growth, while a negative value indicates a decline in sales. |
| Net Sales (LCY) | Shows the actual revenue generated after accounting for returns and discounts. | Total Sales − Returns − Discounts | Provides a clearer picture of the true revenue generated from the product. |
| Gross Margin (%) | Measures product profitability by comparing revenue with the cost of goods sold. | (Net Sales − Cost of Goods Sold) ÷ Net Sales | A higher percentage reflects better product profitability. |
| Return Rate (%) | Measures the proportion of returned items relative to total items sold. | Returned Quantity ÷ Total Sold Quantity | A lower return rate indicates better product quality and higher customer satisfaction. |
Copilot Integration
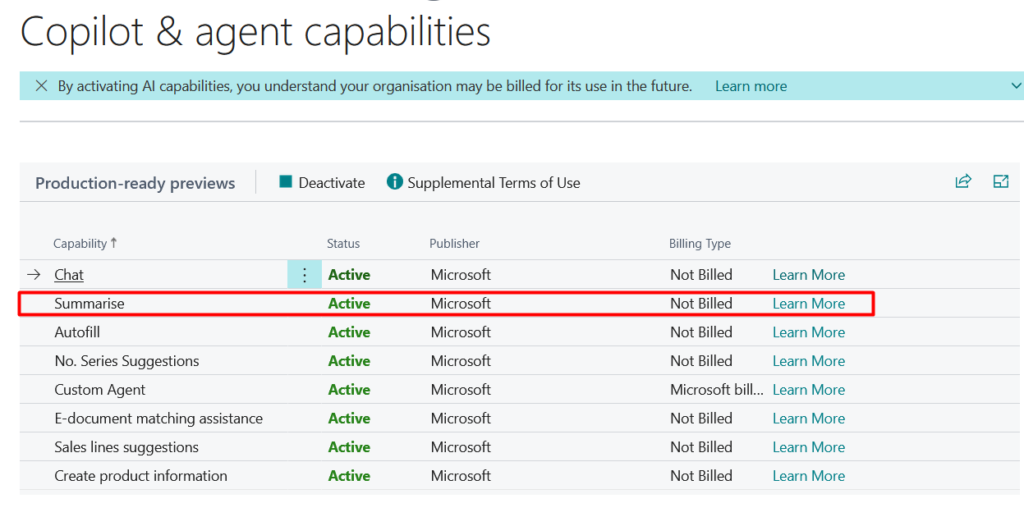
When the Summarize with Copilot capability is enabled in Microsoft Copilot, the Item Statistics experience becomes even more powerful.
Copilot can help summarize performance insights and assist users in understanding key trends quickly.
How to Use Item Statistics in Business Central
Follow these steps to access the new feature.
Step 1: Enable Copilot Capability : Navigate to: Copilot & Agent Capability Page, Ensure Summarize with Copilot is enabled.
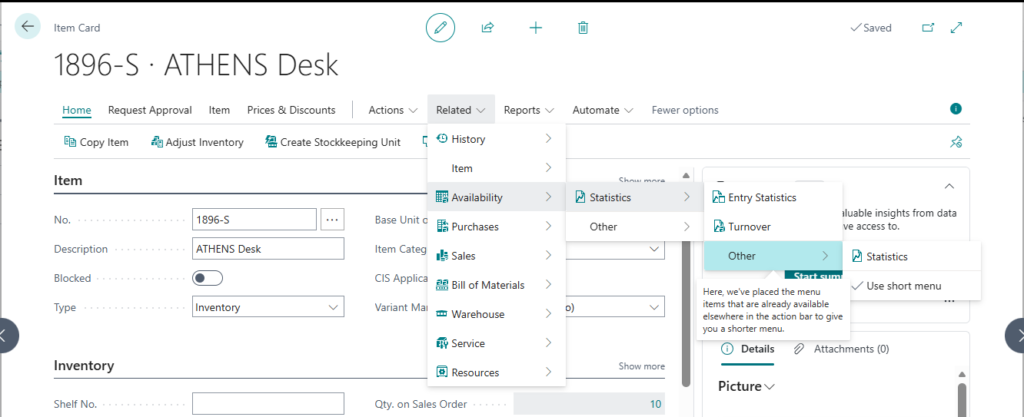
Step 2: Open Item Statistics
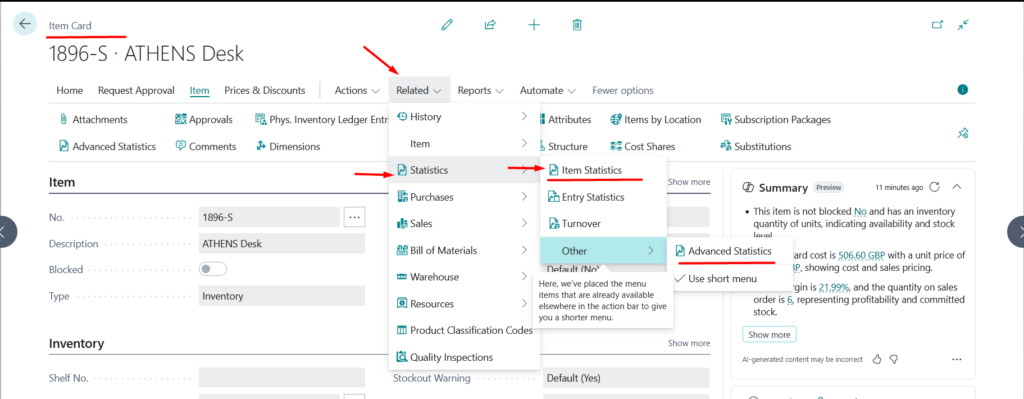
Go to Item Card
Click Related
Navigate to Statistics
Select Item Statistics
Step 3: Review the Item Statistics Page
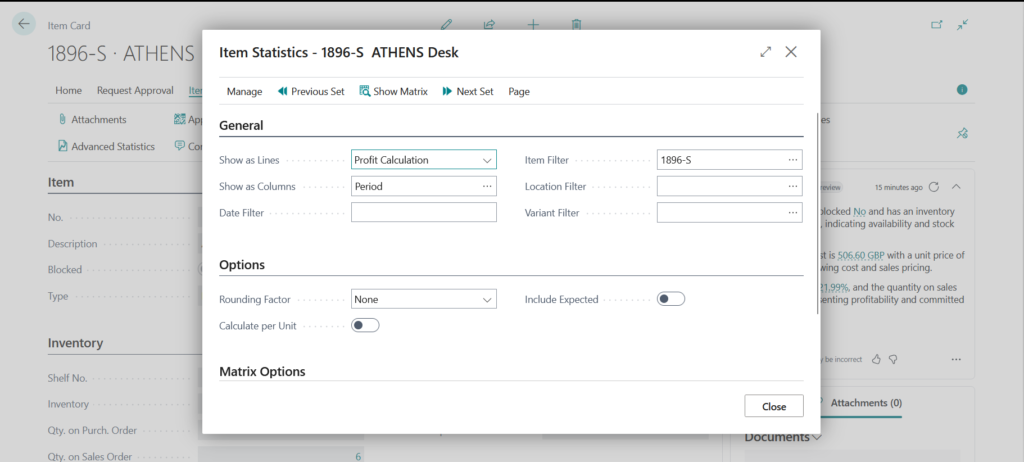
A Business Central pop-up window will open showing:
Inventory Value
Expired Inventory Value
Sales metrics across different periods
Step 4: Perform Advanced Analysis
For deeper analysis: Navigate to Advanced Statistics.
Here you can:
Apply filters
Analyze specific time periods
Review item performance more granularly
What’s Changed from Previous Versions?
Earlier versions of Microsoft Dynamics 365 Business Central only included:
Entry Statistics
Turnover page
In Business Central 28, Microsoft has introduced two additional pages, including the Item Statistics page, providing much richer analytical capabilities.
Important Notes
This feature is available as a production-ready preview in both production and sandbox environments.
Supported across all country/region localizations.
Microsoft currently supports English and selected languages.
AI-generated insights may not always be perfectly accurate.
Copilot follows Microsoft’s enterprise-grade standards for:
Security
Privacy
Compliance
Responsible AI
Microsoft also maintains a strict policy that customer data in Business Central is not used to train AI models.
Final Thoughts
The Item Statistics feature in Business Central 2026 Wave 1 (BC28) is a major step toward data-driven inventory management.
By combining:
Inventory valuation
Sales performance metrics
Profitability insights
AI-driven summaries
Businesses can gain a clearer picture of product performance and make smarter inventory decisions.
This enhancement will be particularly valuable for organizations focused on improving product profitability, reducing obsolete inventory, and optimizing sales strategies.
Stay tune for more updates…!